Azure Monitor Dashboards
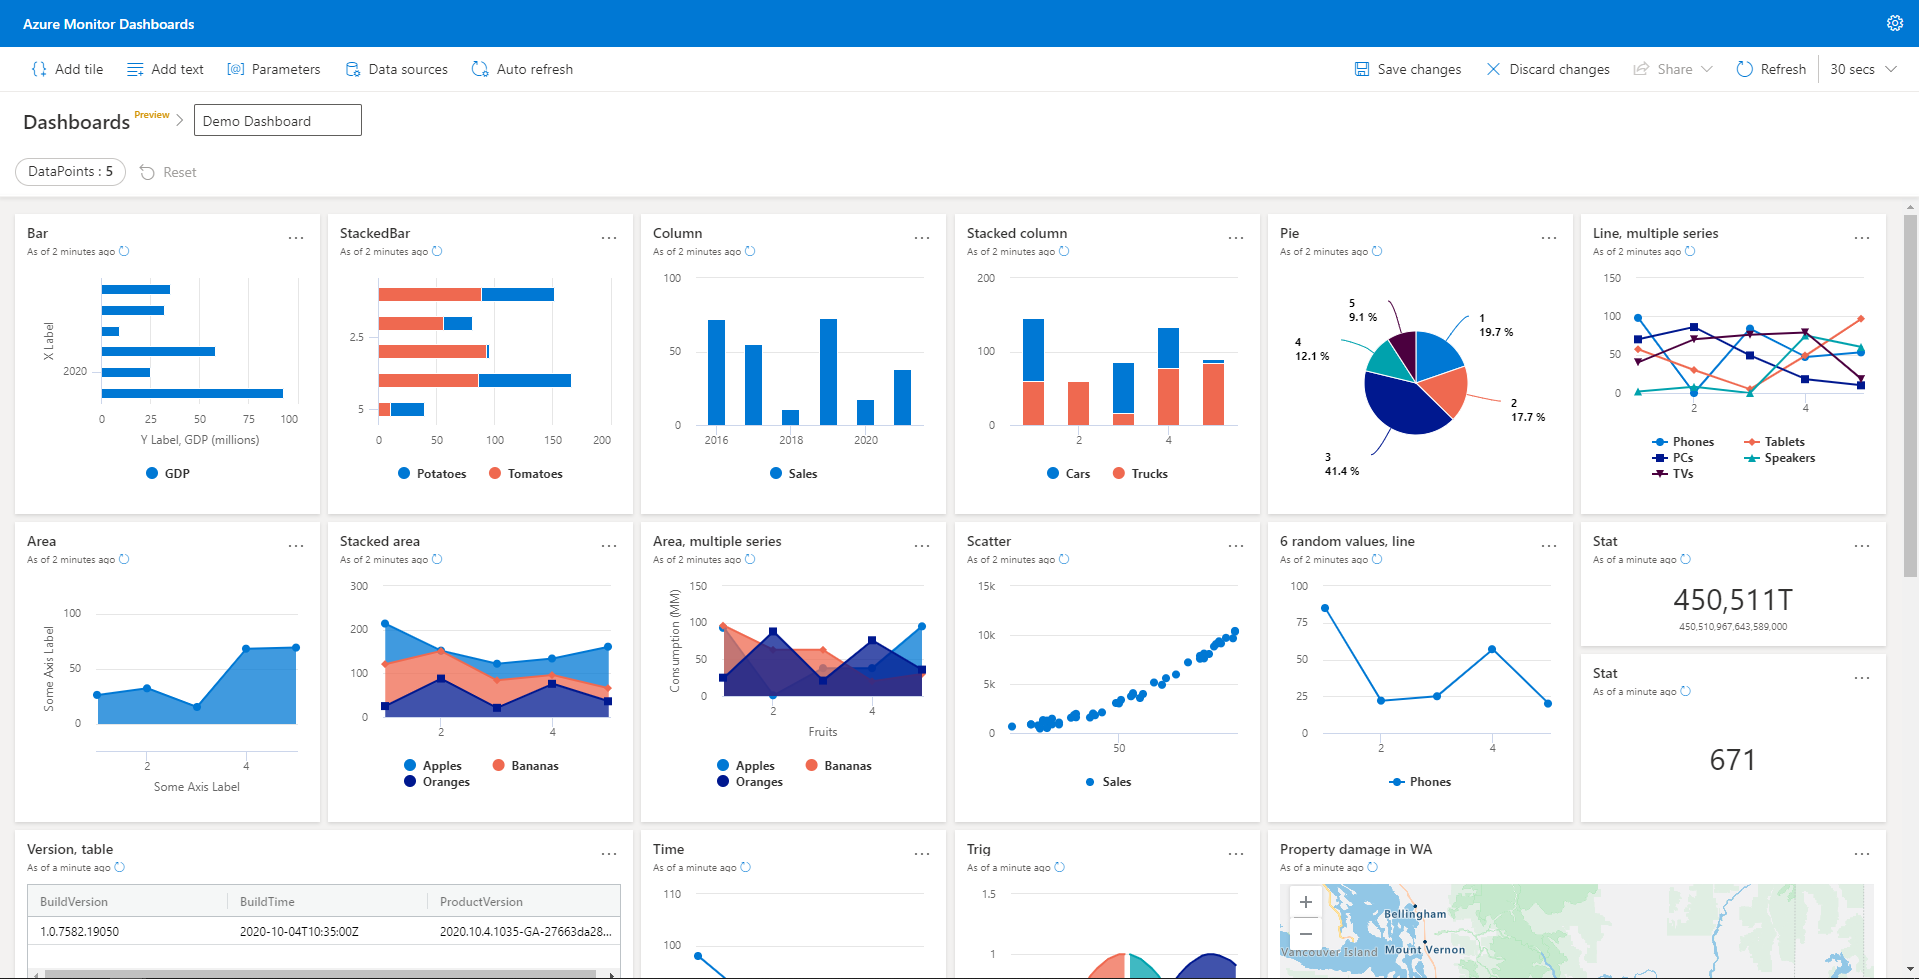
Azure Monitor Dashboards is a standalone, performant, real-time dashboarding platform which currently supports ADX and LA as data sources with more (Metrics, AI etc.) to be added in future. Long term goal for Azure Monitoring Dashboard is to be a one-stop solution for all the azure monitoring needs.
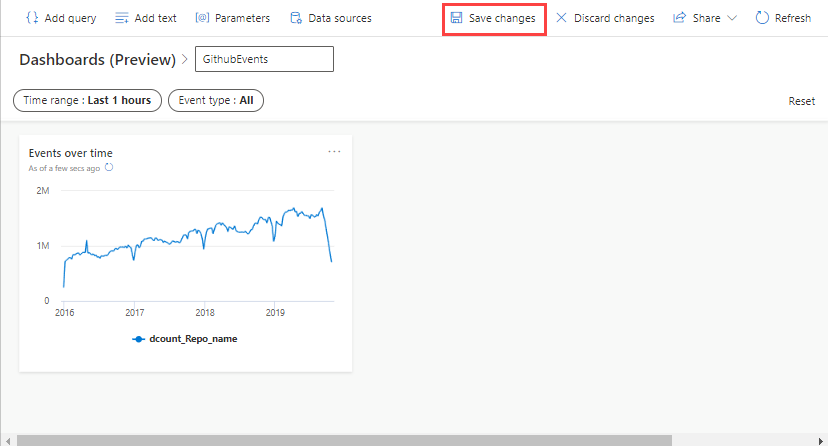
The following image depicts an Azure Monitor Dashboard.
The goal of this page is to quickly get you up and running with the Azure Monitor Dashboards by describing the steps necessary to create a dashboard.
Prerequisites
KQL
We assume that you have some familiarity with KQL (Kusto Query Language). If not, you can find a quick tutorial here.
Create a dashboard
-
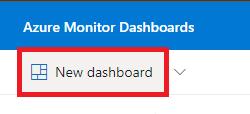
In the navigation bar, select Dashboards and select New dashboard.
-
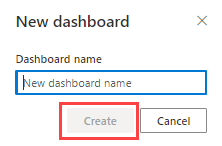
Select a dashboard name and Create.
Add data source
Add the required data sources for the dashboards.
-
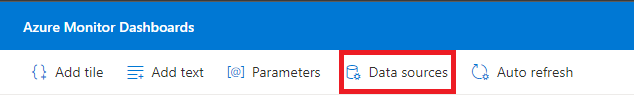
Select Data sources menu item on the top bar. Select the + New data source button in the Data sources pane.
-
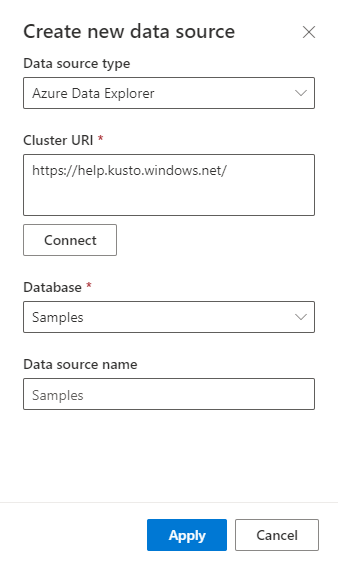
In the Create new data source pane:
-
Select the Data source type For Azure Data Explorer data source
- Enter the Cluster URI or partial name including region and select Connect.
- Select the Database from the drop-down list.
- Use the default or modify the Data source name, if needed.
- Select Apply.
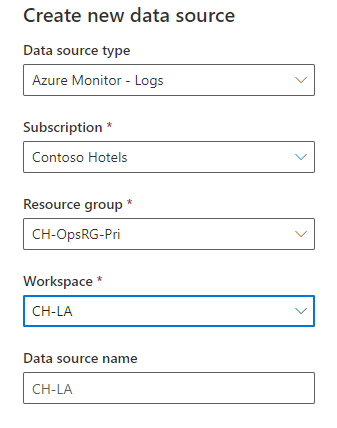
For Azure Monitor - Logs data source
- Select a Subscription from the drop-down list.
- Select a Resource group from the drop-down list.
- Select a Workspace from the drop-down list.
- Use the default or modify the Data source name, if needed.
- Select Apply.
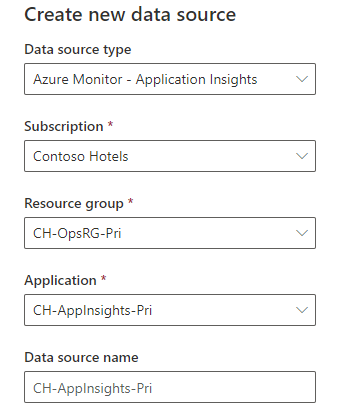
For Azure Monitor - Application Insights data source
- Select a Subscription from the drop-down list.
- Select a Resource group from the drop-down list.
- Select a Application from the drop-down list.
- Use the default or modify the Data source name, if needed.
- Select Apply.
-
Use Parameters
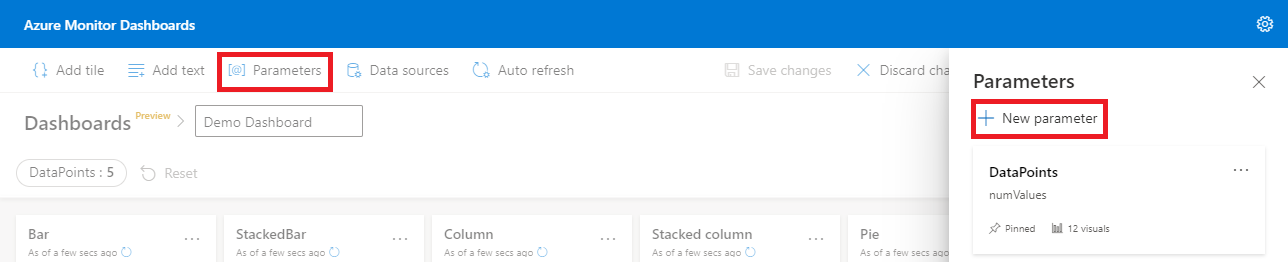
Parameters enable using dashboard filters. Parameters significantly improve dashboard rendering performance and enable you to use filter values as early as possible in the query. For more information about using parameters, see Use parameters in Azure Monitor dashboards.
-
Select Parameters on the top bar. Select the + New parameter button in the Parameters pane.
-
Enter values for all the mandatory fields and select Done.
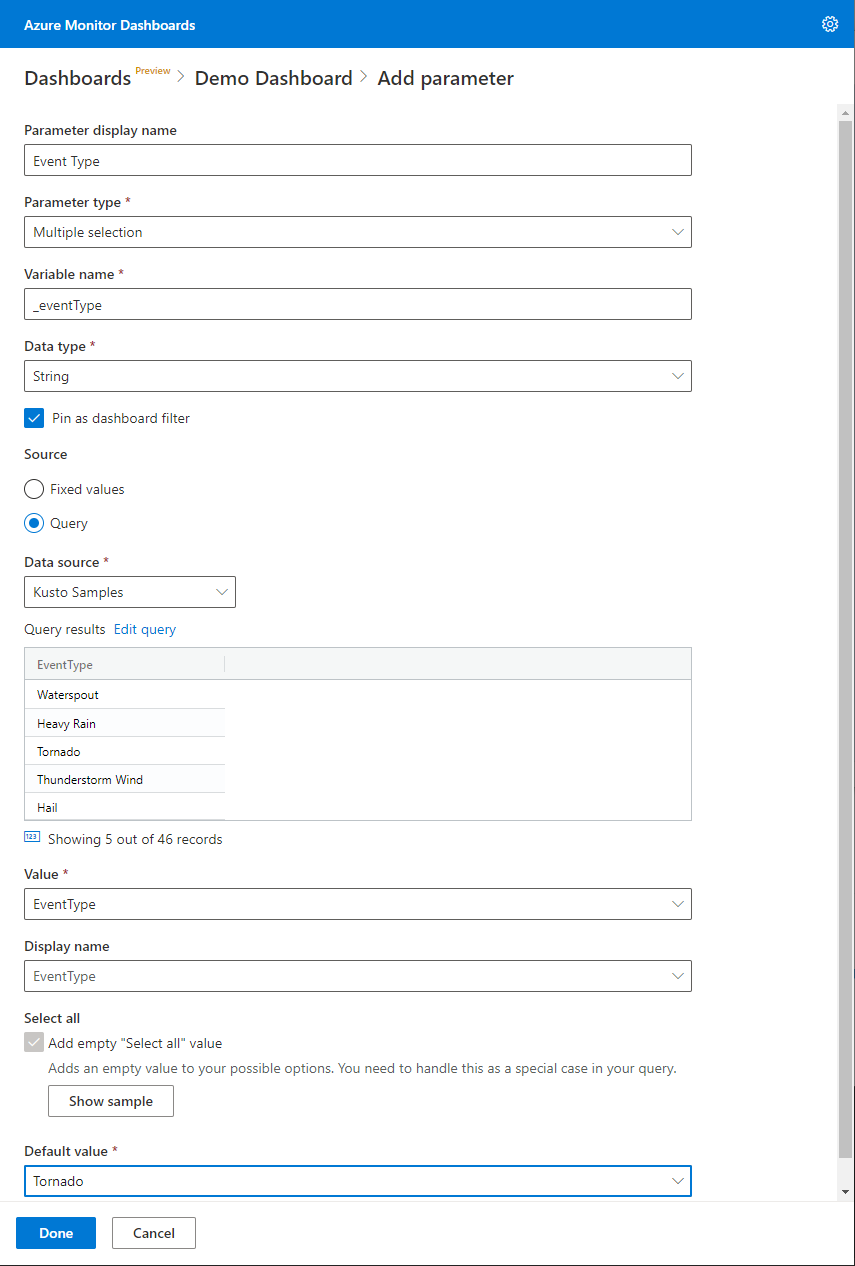
| Field | Description |
|---|---|
| Parameter display name | The name of the parameter shown on the dashboard or the edit card. |
| Parameter type | One of the following:
|
| Variable name | The name of the parameter to be used in the query. |
| Data type | The data type of the parameter values. |
| Pin as dashboard filter | Pin the parameter-based filter to the dashboard or unpin from the dashboard. |
| Source | The source of the parameter values:
|
| Add a “Select all” value | Applicable only to single selection and multiple selection parameter types. Used to retrieve data for all the parameter values. |
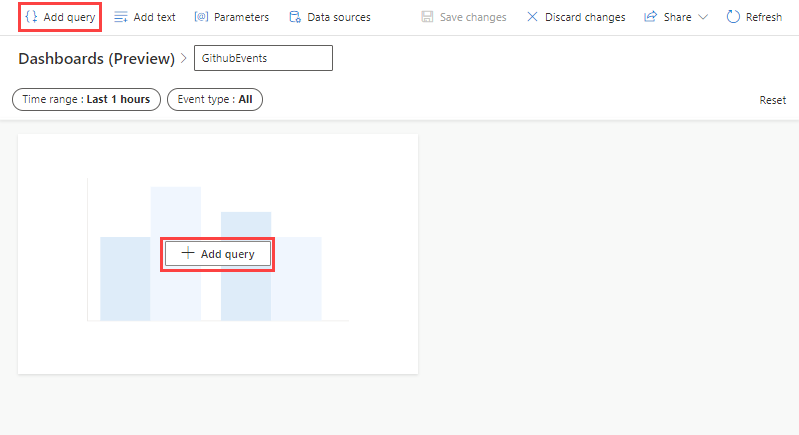
Add Query
Add Query uses Kusto query language snippets to retrieve data and render visuals. Each query can support a single visual.
-
Select Add Query from the dashboard canvas or the top menu bar.
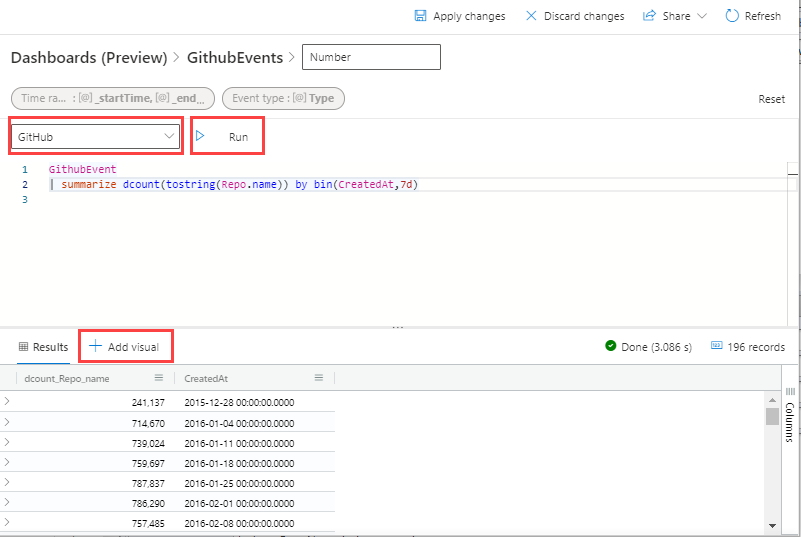
-
In the Query pane,
- Select the data source from the drop-down
- Type the query, and select Run
- Select + Add visual
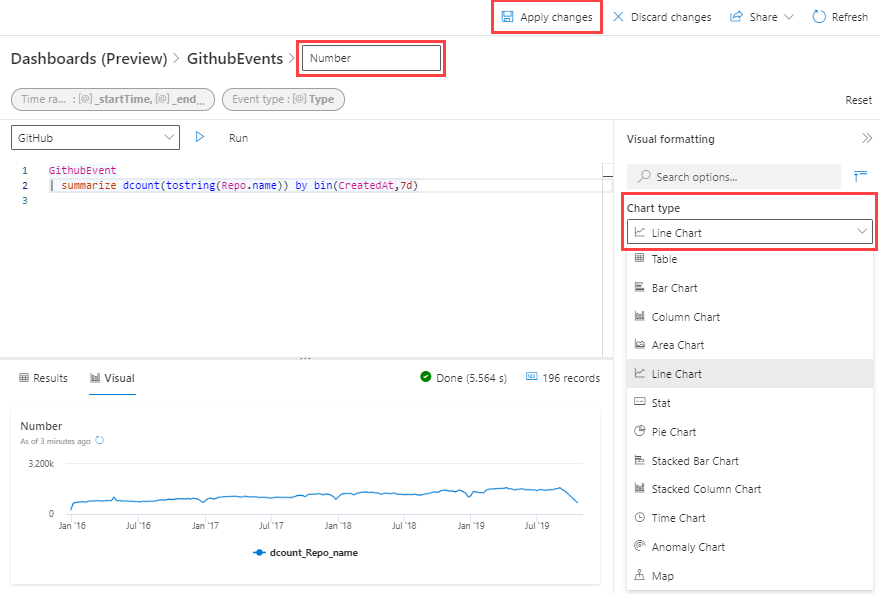
-
In the Visual formatting pane, select Chart type to choose the type of visual.
-
Name the visual and select Apply changes to pin the visual to the dashboard.
-
You can resize the visual and Save changes to save the dashboard.
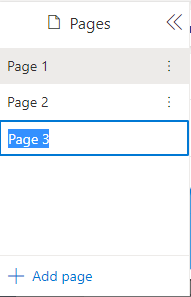
Organize the dashboards with pages
You can use pages to easily organize the tiles in your dashboards in multiple pages or combine multiple related dashboards into one.
-
Open the Pages pane from the left side and select Add page.
-
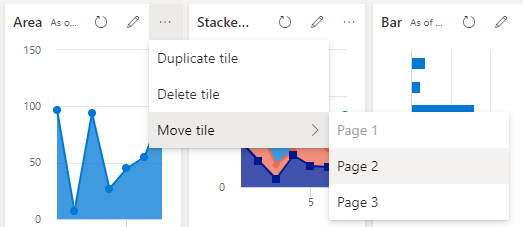
Select the Move tile option to place a tile on a specific page.
-
Pages can be rearranged easily by dragging them to the correct position.
Share dashboards
Use the share menu to grant permissions to the dashboard, change a user's permission level, and share the dashboard link.
[!IMPORTANT] To access the dashboard, a dashboard viewer needs the following:
- Dashboard link for access
- Dashboard permissions
- Access to the underlying database/workspace
-
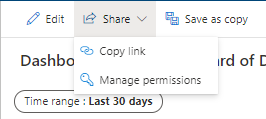
Select the Share menu item in the top bar of the dashboard.
-
Select Manage permissions from the drop-down.
Grant permissions
To grant permissions to a user in the Dashboard permissions pane:
- Write the user's name or email in Add new members box.
- Select the Permission level as Can view or Can edit and then click Add.
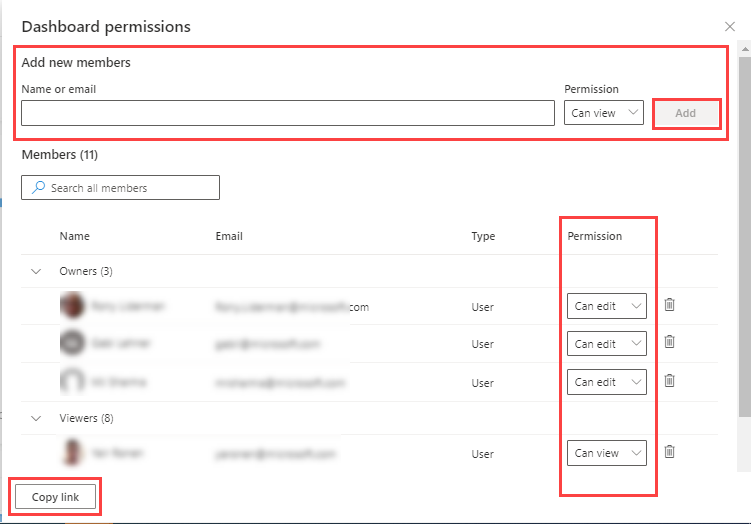
Change a user permission level
To change a user permission level in the Dashboard permissions pane:
- Use the search box or scroll the user list to find the user.
- Change the Permission level as needed.
Share the dashboard link
To share the dashboard link:
- Select Share drop-down and then select Copy link Or
- In the Dashboard permissions window, select Copy link.
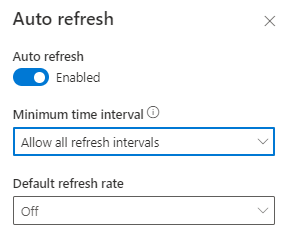
Enable auto refresh
-
Select Edit in dashboard menu to switch to edit mode.
-
Select Auto refresh.

-
Toggle the option so auto refresh is Enabled.
-
Select values for Minimum time interval and Default refresh rate.
-
Select Apply and Save the dashboard.
[!NOTE]
- Select the smallest minimum time interval to reduce unnecessary load on the cluster.
- A dashboard viewer:
- Can change the minimum time intervals for personal use only.
- Can't select a value which is smaller than the Minimum time interval specified by the editor.
Next Steps
Support or Contact
If you run into trouble or have bugs/ feature requests, please reach out to us here: Azure Monitor Dashboard Support and we’ll help you sort it out.